
Where does a salaried Indian’s income really go? A data-backed breakdown of expenses, EMIs, rent, and spending habits reveals why the middle class feels financially stretched today.

Everyone has an opinion on why the middle class is struggling. Too much eating out. Too many EMIs. Too much Amazon. Not enough discipline.
But opinions aren't data. So let's look at what the numbers actually say, because when you break down where a salaried Indian household's money goes each month, the picture that emerges is more complicated, and more revealing, than the usual takes suggest.
Before diving into the spending, it's worth being precise about who "the salaried middle class" actually is, because this group covers a wide range.
India's PRICE (People Research on India's Consumer Economy) institute defines the middle class as households earning between ₹5 lakh and ₹30 lakh annually at 2020-21 prices. By their projections, this group made up 31% of India's population in 2021 and is expected to grow to 47% by 2031. That's hundreds of millions of people.
For this piece, we're focused on urban salaried earners, the IT professional in Pune, the bank manager in Lucknow, the marketing executive in Bengaluru, roughly those earning between ₹30,000 and ₹1,00,000 per month who depend on a monthly paycheck. The Perfios-PwC report "How India Spends," based on data from over 30 lakh tech-savvy consumers, gives us some of the most granular numbers available on exactly this group.
So where does the money actually go?
The Perfios-PwC study found that salaried Indians divide their spending into three broad buckets:
39% goes to obligatory expenses- things like loan EMIs, insurance premiums, and rent. These are the non-negotiables that hit before anything else.
32% goes to necessities- groceries, utilities, fuel, medical expenses, school fees. Things you need but have some control over.
29% goes to discretionary spending- dining out, entertainment, subscriptions, clothing, travel, and everything else.
That breakdown alone tells you something important: nearly 40 paise of every rupee a salaried Indian earns has already been committed before the month even starts.
The single most striking data point in the spending research is this: salaried individuals across India allocate more than 33% of their monthly income toward loan EMIs alone.
That's one in three rupees, gone before you've bought a single grocery item.
This isn't a niche problem. The Perfios-PwC data found this holds true across income levels, from those earning ₹20,000 a month to those earning above ₹75,000. As income grows, EMI amounts grow proportionally. The percentage stays stubbornly similar.
Home loans account for most of this, especially in metros. But personal loans, vehicle EMIs, and increasingly, consumer durables bought on credit, all pile on. India's household debt reached 38% of GDP in FY23, according to a CareEdge report, and the RBI data shows net financial savings fell to 5.1% of GDP in 2022-23, the lowest in decades. Households were drawing down savings and taking on more debt just to maintain their standard of living, not to upgrade it.
For a typical lower-to-middle income urban household, after EMIs come the two other giants: groceries at around 26% of monthly expenses and rent at around 21%, according to the Home Credit India Great Indian Wallet study covering 2,500 respondents across 17 cities.
Rent figures vary significantly by city. Chennai households allocate as much as 29% of expenses to rent, while Kolkata and Jaipur come in at around 15%. The government's own HCES 2023-24 survey (covering over 2.6 lakh households) confirms that rent accounts for roughly 7% of average urban monthly per capita expenditure, but that average is pulled down by households that own their homes. For the renters, which describes most young urban salaried workers, the share is substantially higher.
Groceries, meanwhile, haven't gotten cheaper. Food and beverage inflation peaked at 9.7% in October 2024, according to The Wire's analysis of government data. The middle class gets no insulation from this, unlike below-poverty-line households that benefit from public distribution system protections, and unlike wealthy households whose asset income partially offsets consumption costs, the salaried middle class pays full price for everything.
Transport has quietly become one of the fastest-growing cost categories for the urban salaried class. The HCES data shows that spending on conveyance now accounts for 7-8% of monthly per capita expenditure in urban areas, up from just 5% in 2000.
That shift reflects several things happening at once: more people commuting longer distances as cities expand outward, the rise of cab aggregators as a daily habit (rather than an occasional luxury), higher petrol and diesel prices, and the growing cost of owning and maintaining a vehicle.
For context, the excise duty on petrol remained at ₹19.90 per litre through most of 2022-23 even as international crude prices fell significantly, meaning the government captured the margin that consumers might have expected to save. The middle class absorbed that cost silently.
Commute spending is 19% of monthly expenses for the average urban household in the Home Credit study, higher, in fact, than children's education.
Speaking of education, it claims roughly 15% of monthly household expenses on average, but the range is extreme. Bengaluru and Kochi households devote up to 23% of expenses to children's education, while Dehradun comes in at 10%.
The HCES data confirms that education spending in urban India has grown significantly over the decades, as families shift away from government schools toward private institutions at all income levels. This isn't purely a lifestyle aspiration, in many cities, access to quality public schooling has declined to a point where private education is the practical default.
The spending doesn't stop at school fees either. Coaching classes, tutoring, extracurriculars, stationery, and devices all add up. For a family with two school-age children in a metro, education-related spending can easily consume 20-25% of take-home pay.
Medical expenses account for roughly 6-7% of average urban monthly per capita expenditure, per the HCES data, but this average hides the volatility underneath it.
Routine spending on medicines and check-ups might be predictable. A hospitalisation isn't. The Perfios data shows that in Tier-2 cities, people spend 20% more on medical expenses than their Tier-1 counterparts, partly because specialist healthcare infrastructure is thinner and partly because illnesses caught later cost more to treat.
The tragic irony is that the salaried middle class is both the group most likely to pay for its healthcare privately (having limited access to government health programmes) and the group least likely to have adequate health insurance. Many employer health policies cap at ₹3-5 lakh, a figure that barely covers a moderate surgery in a private hospital in any major Indian city.
Run the numbers on an average urban salaried household earning ₹60,000 a month and the residual after obligatories, rent, groceries, transport, education, and health can be surprisingly thin. Sometimes dangerously so.
What does remain gets spread across utilities and bills (~6% for electricity, ~2% for mobile, plus internet), clothing and personal care, and finally, discretionary spending, eating out, entertainment, subscriptions, and anything that feels like leisure.
That 29% discretionary figure sounds generous until you remember it's the last call on a budget that's already been carved up by rent, EMIs, school fees, and petrol. In practice, it's where the most emotional spending happens, and where the most guilt tends to follow.
There's one structural shift in the data that isn't captured in the traditional spending categories but is reshaping how money flows out of middle-class households: the near-total dominance of UPI for daily transactions.
The RBI reported over 14,726 crore digital payment transactions in FY24. UPI is now the default for everything from chai at the local tapri to large monthly grocery bills. The Perfios study found that UPI dominates for discretionary and necessary expenses across all income groups.
This matters for spending awareness because UPI makes it frictionless to spend, often too frictionless. There's no moment of handing over physical cash. No visible dwindling of a wallet. Money moves at the tap of a phone, and the psychological brakes that cash once provided are gone.
The upside is that every UPI transaction is now a data point, for you, and for your bank. The smarter move is to make sure each of those transactions is working for you, not just against your balance. Linking a rewards-based RuPay credit card like SalarySe's LevelUP to your UPI payments means the grocery run, the Swiggy order, the Ola ride, categories that consume a combined 40-50% of the average salaried budget, start generating real cashback instead of just draining the account.
Step back from the individual categories and a clear picture emerges: India's salaried middle class is not spending recklessly. It is spending on housing, food, children, health, and getting to work, the foundational costs of urban life that have grown faster than salaries have.
The PRICE institute projects India's middle class will grow to nearly 60% of the population by 2047. But for that to happen, the people in it need to actually feel financially stable, not just technically non-poor. And right now, a third of their salary going to EMIs before the month starts doesn't feel like stability.
The data doesn't support the narrative that the middle class is splurging its way into financial trouble. It supports a different story: fixed costs are high, wage growth has been uneven, and the margin for error, or savings, is smaller than most people are comfortable admitting out loud.
Understanding where your money goes isn't just interesting. In a budget this tight, it's essential.

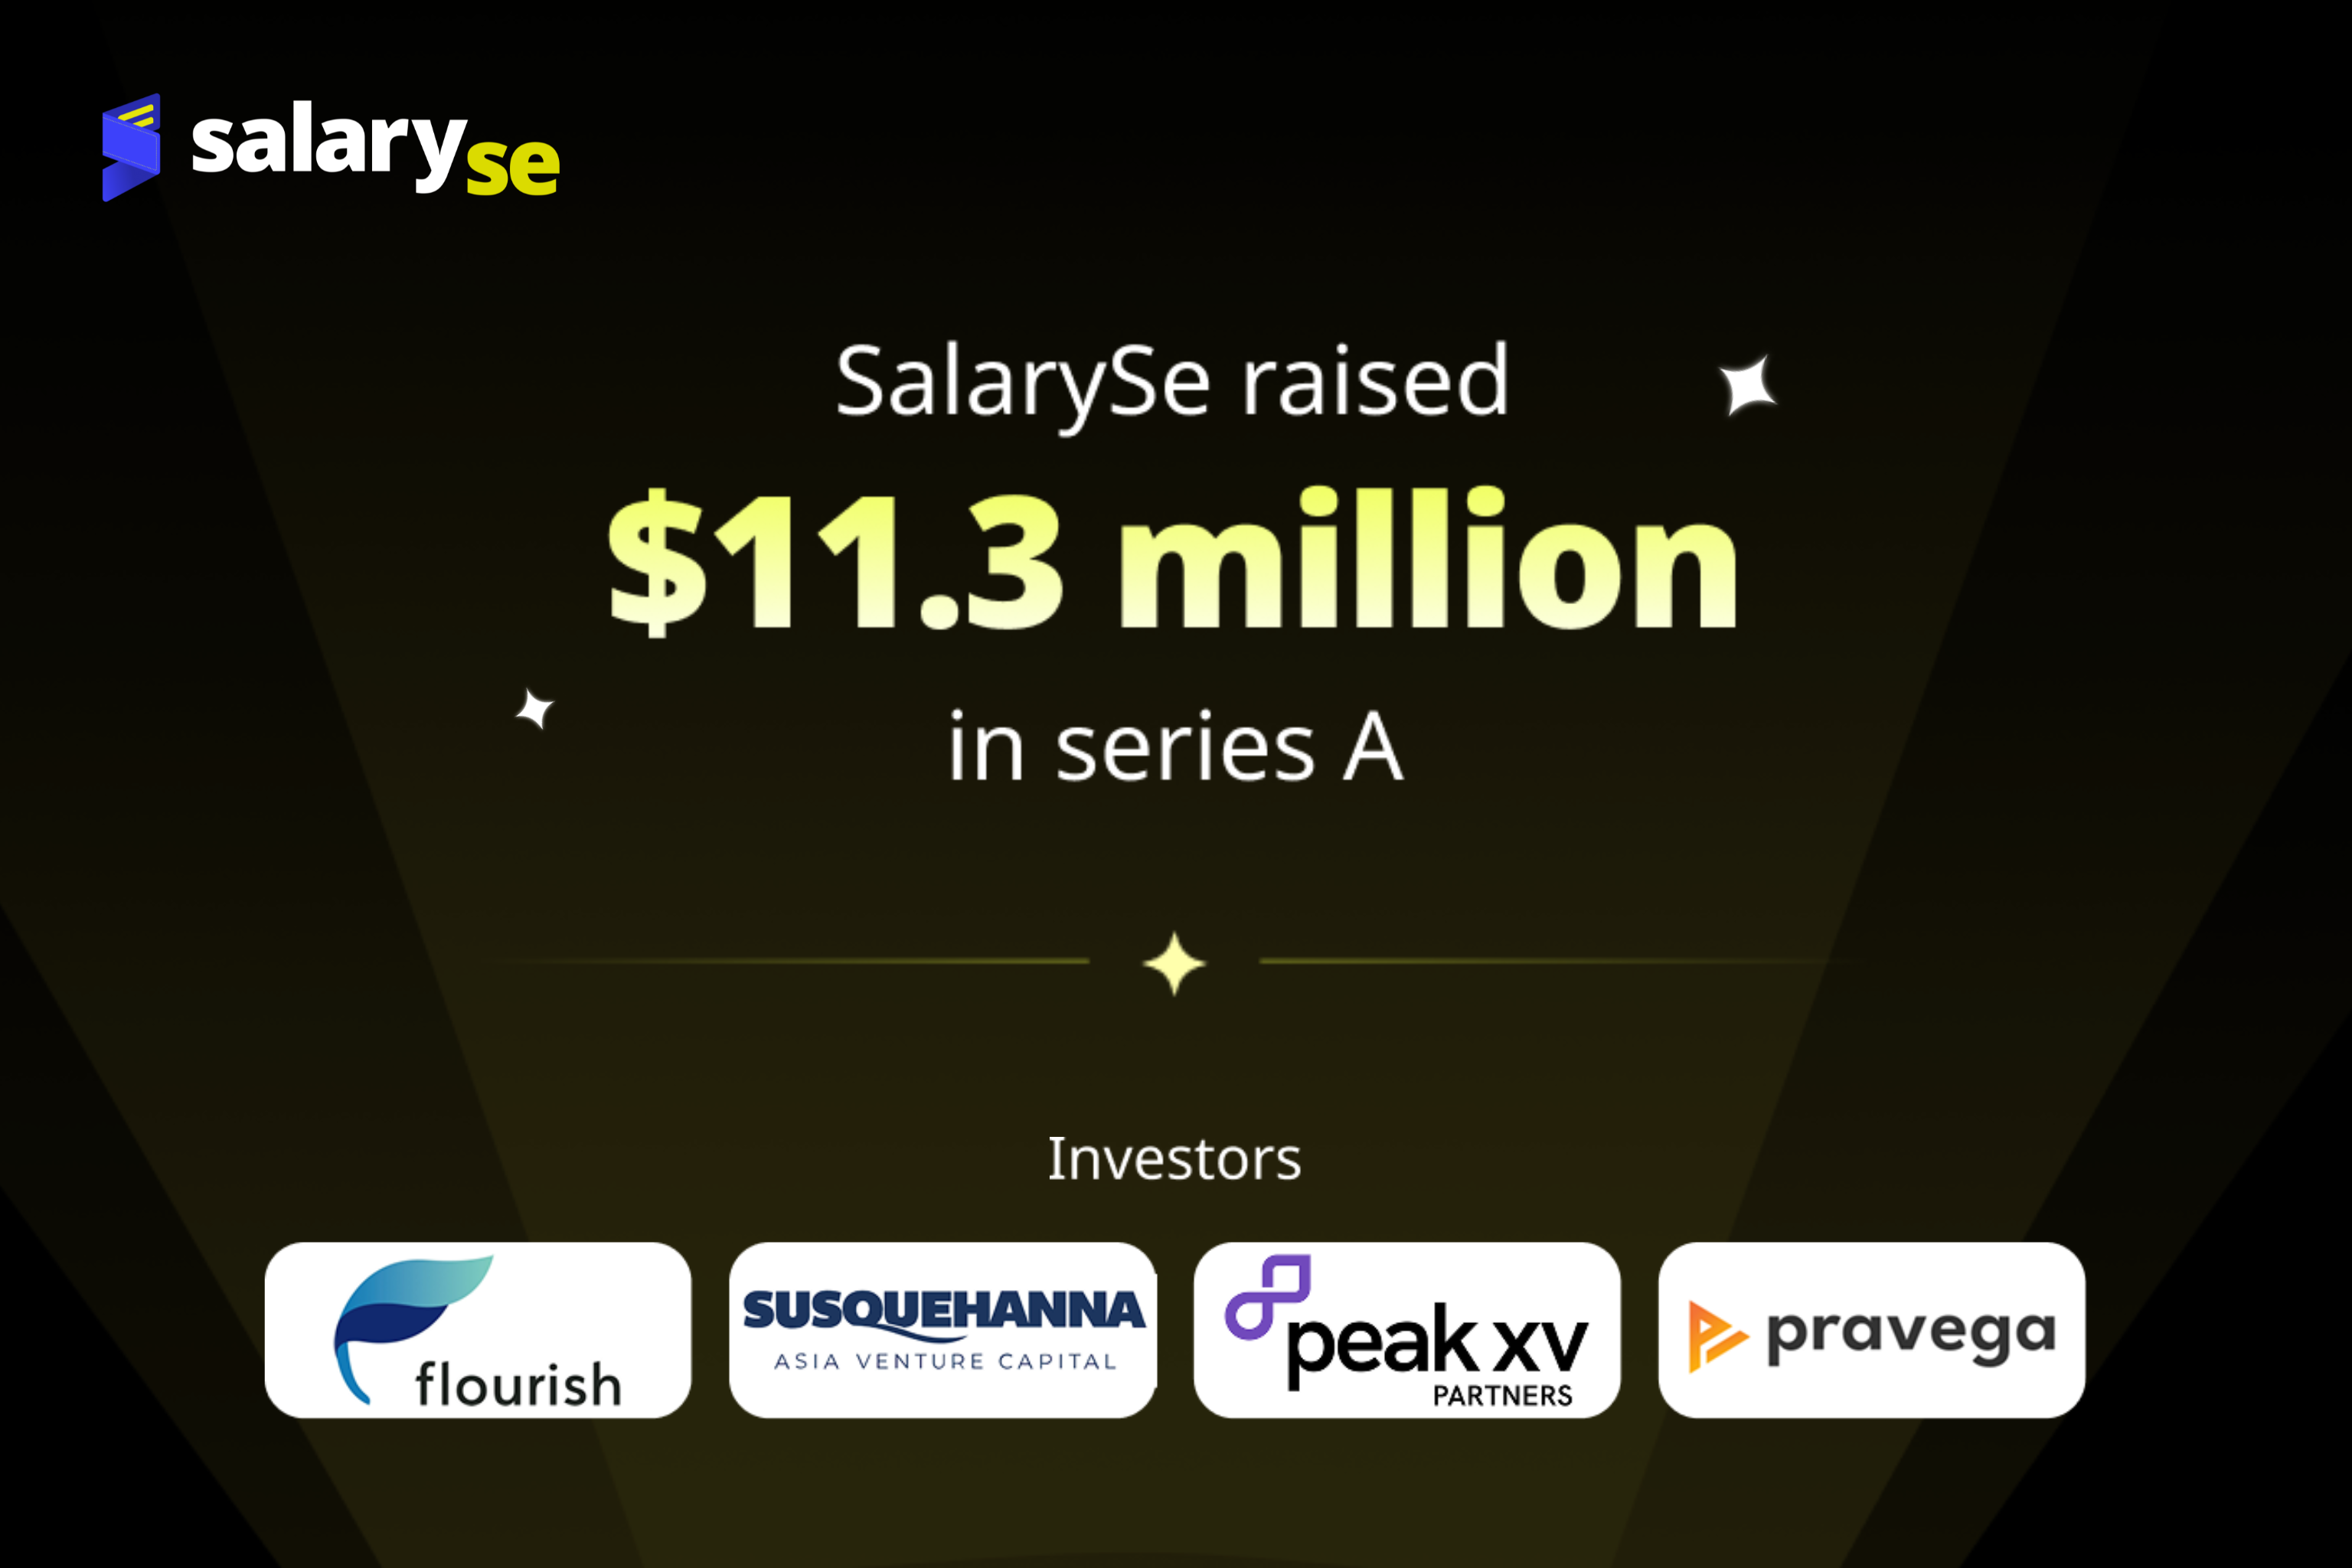
SalarySe raises $11.3M to redefine credit access for India’s workforce. Led by Flourish Ventures and SIG Venture Capital, with support from Peak XV Partners and Pravega Ventures, the funding will fuel AI-led innovation, enterprise expansion, and smarter financial solutions for salaried professionals.

What organisations are calling quiet quitting is often financial anxiety presenting as disengagement. Smart employers are addressing the root cause, not the symptom.

India's employee Benefits landscape is shifting from slow, manual reimbursements to intelligent, real-time tax savings, and forward-thinking HR leaders are already making the switch.